Pink and Blue…
 … Brains
Or, Yes, We Now CAN Tell The Sex of a Person By Imaging Their Brain
Before recent developments in neuroimaging, I would have said that there was no way that we could determine the sex / gender of a person looking only at their brain. In fact, I DID say exactly that. But now, I don’t believe that that is an accurate statement, at least not wholely accurate, because a recent paper/letter has shown that with increased resolution and computer power we can determine the sex of a person that a particular brain resides in just from an analysis of the 3D image of their brains to 93% accuracy. The mere fact that this can be done shows that the human brain is in fact highly sexually dimorphic, because if we were to simply guess, we would only be right 50% of the time.
The number, 93%, sounded suspiciously familiar to me. That’s about the number of people who are not LGBT in the population. Given that we also know that LGB people are likely to have sexually dimorphic features that as a population, are shifted towards that of the opposite sex, I’m proposing an hypothesis and a prediction. If this analysis were redone excluding all known LGBT people, that the mathematical regression would result in greater predictive strength. It would not reach 100% because there would still be those who due to social desirability bias would fail to disclose their sexual orientation and thus still be included in the heterosexual study group. Increasing the accuracy in that instance will add evidence to a quip that I have made before, that humans don’t have male and female brains so much as androphilic and gynephilic brains.
There’s an important point that is missed by people with discussing the issue of whether the human brain is sexually dimorphic or not; The size and shape of any specific feature of the brain is to an extent only a very crude estimate of the number of neurons and the connection density of that region. It does not tell us the functional differences, if any, that that difference represents. As Cordelia Fine has pointed out, these differences, though they clearly exist, does not tell us what, if any, the differences may be in men’s and women’s minds. Only additional research will help us determine these.
But still, anyone who still says that it is not possible to determine the sex of a human brain hasn’t been keeping up with the science.
 (Addendum 3/4/2017: I did a bit of calculation and found much to my amazement, that to “guess” the sex of the brain to 93% accuracy means that the effect size (Cohen’s d) would, if it were a single dimorphic feature, be a whopping 3.0 !!!! That’s an over the top value. Thus, as we get better imaging tools to see the fine details, we are learning that the human brain, in terms of multivariate statistics of multiple measurements at all points of the brain, is in fact extremely sexually dimorphic. The problem is that no one area is all that dimorphic, but in aggregate, they are quite dimorphic. That is to say, if one area is slightly dimorphic, giving a small statistical clue as to the sex of the individual, and a second area is also slightly dimorphic, giving a small clue as the sex of the individual, the two can be used together to give a medium sized clue to increase the accuracy… and with many many areas, each additively pointing towards one sex or the other, the accuracy gets quite good.)
Further Reading:
Book Review: Delusions of Gender by Cordelia Fine
References:
Chekrouda, et al., “Patterns in the human brain mosaic discriminate
males from females” http://www.pnas.org/content/113/14/E1968.full.pdf
nt, C., Förster, K., Koser, S.A. et al. Biological sex classification with structural MRI data shows increased misclassification in transgender women. Neuropsychopharmacol. 45, 1758–1765 (2020). https://doi.org/10.1038/s41386-020-0666-3
Wiersch, L., Hamdan, S., Hoffstaedter, F. et al. Accurate sex prediction of cisgender and transgender individuals without brain size bias. Sci Rep 13, 13868 (2023). https://doi.org/10.1038/s41598-023-37508-z
Once Again, With Feeling…
 Or, How Do We REALLY Know That There Are Two Types of Transwomen?
One would think that with years of both clinical and scientific evidence to support the Two Type Taxonomy of MTF transexuality, we would no longer have need of essays that explain how we know this to be true, but no… sillyolme, nothing is so obvious as to be truly self-evident. So, once again, it’s time to write a clear, concise, yet also complete explication of how we know that there are two and only two types of transwomen.
First, we need to know a bit about epidemiological research into etiology. In medical science we often recognize that a given medical entity exists because of its pattern of symptoms that collectively we call a syndrome. After recognizing a syndrome, science then attempts to determine an etiology, if it can. Here it is important to recognize that the existence of a given symptom in itself does not define a syndrome. Consider fever as a symptom. Today, after much research, we know that it is caused by our immune system attempting to fight off an infection. But that infection may be from any of literally millions of different entities, from eukaryotic parasites, bacteria, to viruses. One would not say that just because two individuals both have fevers, or that a given medicine helps reduce both individual’s fevers, that they have the same etiology. Yet, when it comes to transsexuals, this seems to be the assumption by both transexuals and the public at large. As I will show, this is just not the case.
We also need to know a bit about statistics, most critically, about the concept of “effect size” and what it means. Effect size is a measure of how different two populations are from one another when comparing their mean (average) and their variance (how much spread in a given measure exists within a given population). If two populations have the same average, they have by definition an effect size between them of exactly zero, no matter the variance within the populations. But even if they do not have the same average, if the variance in each is so large that it dwarfs the difference in average, it has a small and not very important effect size. But if two populations have a difference in their average and no overlap in their variance, than there is a large effect size. We calculate the effect size using a standard formula called “Cohen’s d”.
Why is this important? Because to determine if there are in fact two (and only two) types, we must show that the Null Hypothesis, the assumption that there is only one type, is wrong by demonstrating that we consistently find that there is a large enough effect size in a number of measures that consistently cluster together. In science we never “prove” an hypothesis… we only disprove one. If the null hypothesis holds, there should be no such effect sizes. So, in this essay, I’m going to review some of the evidence, demonstrating that there are respectable effect sizes and that they consistently cluster together. Here’s the key, we DON’T have to show that that there are characteristics that give 100% vs. 0%… only that there ARE differences, respectfully large effect sizes, in order to disprove the null hypothesis. In fact, if a study did show 100% vs. 0%, we would expect that the data was bogus, made up, given well known real world difficulties in getting perfectly truthful and accurate answers from people.
Further Reading on Effect Size
Having prefaced our discussion, let’s describe our hypothetical two types, as described by experienced clinicians:
One group is exclusively attracted to men, transitions quite young, passed as girls/women with relative ease, were noted to be feminine (sissy boys) by parents and teachers as children, preferred female playmates, avoided rough’n’tumble play, and were unlikely to report finding wearing women’s clothing to be sexually arousing.
The other grouping was sexually attracted to women (as evidenced by extensive sexual experience with women, marriage, and siring children) but may identify as bisexual or asexual, transitioned later in life, rarely passed successfully as women, were considered to have been typical boys (“boyish”) by their parents and teachers, and were very likely to report finding wearing women’s clothes to be, or once had been, sexually arousing.
But what is the evidence and how large are the effect sizes?
Let’s look at some data. In a study by Lawrence, conducted in 2005 among those who had had SRS by Toby Meltzer, she has three groups, those who had always been exclusively into men (androphilic), those who had always been exclusively into women (gynephilic), and those who claimed that their sexuality has switched from women to men (bisexual).
| Attraction before SRS/Attraction after SRS: | F/M | F/F | M/M |
|---|---|---|---|
| Participant characteristic | (n = 30) | (n = 50) | (n = 17) |
| Mean age at SRS (SD) | 45 (8.4) | 44 (9.1) | 34 (9.2) |
| Mean age at living full-time in female role (SD) | 42 (11.3) | 42 (9.6) | 28 (8.8) |
| Very or somewhat feminine as a child, in own opinion | 41% | 45% | 76% |
| Very or somewhat feminine as a child, in others’ probable opinion | 21% | 24% | 76% |
| Autogynephilic arousal hundred of times or more before SRS | 52% | 58% | 18% |
.
So, let’s look at the effect size of ages at SRS and of social transition. When we compare those who had been consistently gynephilic to those who would best be described as bisexual (having claimed sexual attraction to both men and women) we see that Cohen’s d for age of SRS is only 0.11, so tiny as to be essentially zero. For age of social transition Cohen’s d is 0.0000 = zero. Thus, we would have to say, for this characteristic and these two populations the null hypothesis is not disproven. Again, this does not mean that the null hypothesis is proven… only that it is not disproven. Gynephilic and bisexual transwomen could be the same underlying etiology… or not.
Oh… but let’s look at the androphilic group compared to these other two groups, shall we? Comparing age of SRS between the bisexual and androphilic Cohen’s d = 1.25, a very large effect size. Comparing their ages of social transition Cohen’s d = 1.48, also a very large difference. Finally, looking at the ages of SRS and ages of social transition between the gynephilic and androphilic groups Cohen’s d = 1.09 and 1.44 respectively. This very powerfully disproves the null hypothesis. Sexual orientation is definitely important and supports the two type hypothesis.
Lest you think this result is from only one study, consider the even larger Nuttbrock study in which we see that of those who have started HRT, fully one half of the exclusively androphilic had done so before they turned age 20, while only one exclusively gynephilic individual had done so.
Our description of the two types also mentioned other characteristics, such as gender atypicality and autogynephilia. Now here, we have a small problem in that we don’t have measures that have a continuous value nor a variance. These were bivalued. However, interestingly, because people don’t always answer perfectly, we can use the number of people who answer a given way as a pseudo continuous measure of the real continuous value. That is to say, if only a small number say yes to a question, it’s likely that the real value is very small. If a large number answer yes to a question, it’s likely that the real value is very large. So, let’s look at the values for self image and likely impression to others of being gender atypical. Oh look, consistent with our earlier conclusion that the gynephilic and bisexual groups were in fact not really different groups, their answers are very similar at 41% vs. 45% and 21% vs. 24%. These are so close, that we might as well agree that they are identical. And once again, we see that the androphilic group scores are quite different at 76%. Notice something very interesting, the androphilic group scores for the two questions are identical, but the gynephilic and the bisexual both have the same difference, strongly supporting the null hypothesis that gynephilic and bisexual are not different. So, consistent with our earlier conclusion, the null hypothesis that there is only one group is very much disproven while the hypothesis that there are two and only two is strongly supported.
Before we leave Lawrence’s study, lets look at the issue of autogynephilia. Again, we have a bivalued question whether one had experienced hundreds (or more) episodes of autogynephilic arousal to wearing women’s clothing. As before, we see that the gynephilic and bisexual groups are very similar at 52% vs. 58%, while the androphilic group had only 18%. So, once again, consistent with our earlier conclusion, the null hypothesis that there is only one group is very very much disproven and the hypothesis that there are two and only two is supported.
Associations between autogynephilia and sexual orientation
in MtF transsexuals and transgender persons
%AGP: Gynephilic (includes bisexual and asexual) vs. Androphilic
| Study | Gynephilic AGP | Gynephilic NonAGP | Androphilic AGP |
Androphilic NonAGP |
||||||
| Blanchard (1985) | 46 | 17 | 15 | 85 | 75% vs. 15% | |||||
| Blanchard et al. (1987) | 60 | 13 | 5 | 47 | 82% vs. 10% | |||||
| Lawrence (2005) | 178 | 21 | 6 | 9 | 89% vs. 40% | |||||
| Smith et al. (2005) | 28 | 16 | 18 | 40 | 64% vs. 31% | |||||
| Nuttbrock et al. (2011) | 131 | 48 | 90 | 301 | 82% vs. 23% | |||||
| TOTALS | 443 | 115 | 134 | 482 | 79% vs. 22% |
Note: The four center columns display numbers of participants
Again, lest you think this result is restricted to only this study, we have seen this replicated by Buhrich (1977), Freund (1982), Blanchard (1985), Doorn (1994), Smith (2005), and Nuttbrock (2011), Laube (2020), in separate studies spanning five decades, collectively involving over a thousand transsexuals to date. In fact, this is one of the most repeated and reconfirmed scientific finding regarding transsexuality.
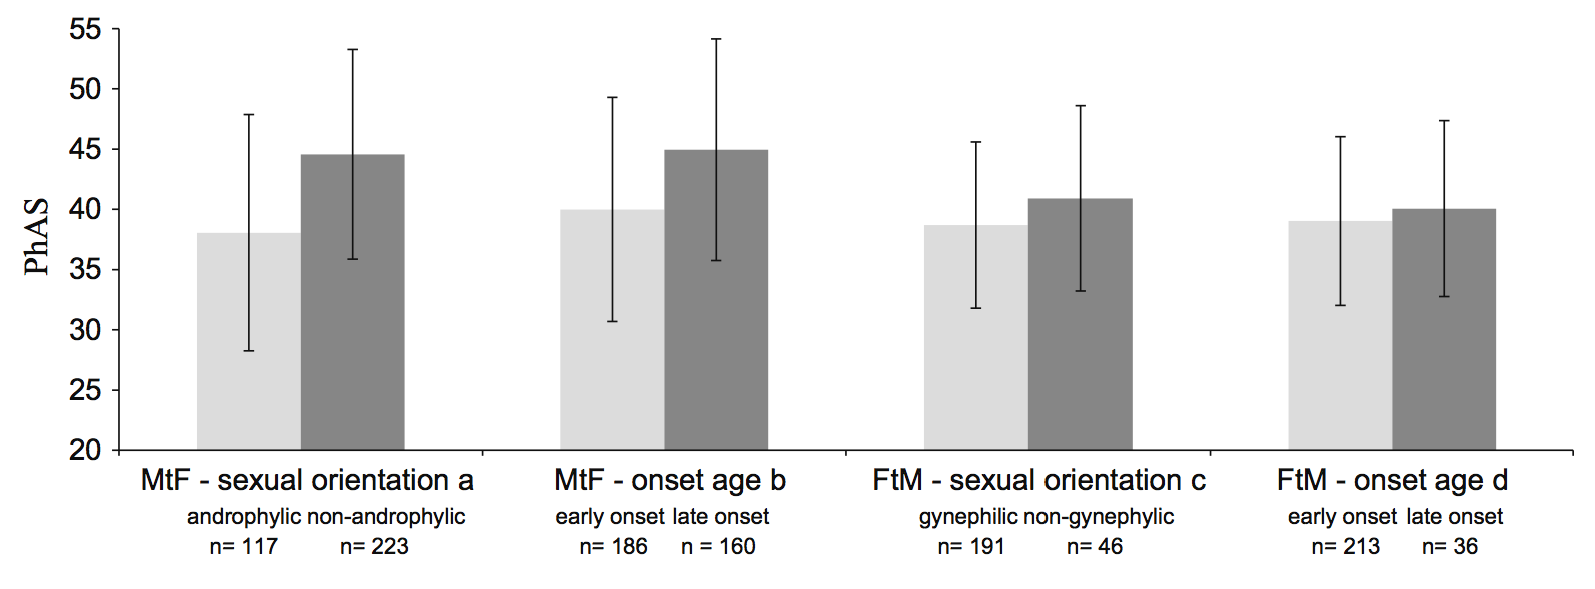
Another characteristic difference mentioned about the two types was passability. Fortunately, we have a clinical study from the Netherlands which showed a robust effect size d = 0.7 difference between androphilic and non-androphilic transwomen. The graph above shows the data. The higher the score, the more ‘readable’ (less passable) the individual. From the graph, we see that the most passable non-androphilic (gynephilic and bisexual) is just average for the androphilic population.
When we add in the growing evidence that there is a distinct difference between the brains of androphilic vs. gynephilic & bisexual, the null hypothesis that there is only one type is not just merely dead, but most sincerely dead.
Addendum 1/15/2018:
Study after study has shown that around 80% to 85% of “non-homosexual” transwomen readily acknowledge experiencing sexual arousal to cross-dressing, at least in adolescence, while they also show that around 50% acknowledge continuing arousal. This leaves 15% or so who say that they never experienced sexual arousal to cross-dressing. As we’ve seen, social desirability bias is strongly operating. At least some percentage of the population is not being honest. Interestingly, there is a new study exploring the subject of honesty and dishonesty. It was discovered that there are three types of people that I shall paraphrase as “always honest”, “mostly honest”, and the “never honest”.
Guess what the percentages were?
“always honest” = 50%
“mostly honest” = 35%
“never honest” = 15%.
Wow, what an interesting coincidence.
Many transwomen who are critical of the two type taxonomy have specifically called out Blanchard and any who accept and advocate the taxonomy as being ugly transphobes for having called transwomen liars. But are we to suppose that transwomen as a population are somehow more saintly and honest than the general population? Phhfft !
https://www.technologyreview.com/s/609924/a-field-guide-to-deception/
Further Reading:
Comments Off on Once Again, With Feeling…

Comments Off on Pink and Blue…